Power analysis
This power analysis tool is designed to estimate the sample size required to achieve a desired power level for a given effect size. The power analysis tool is based on the Twist Human Methylome Panel targets 3.98M CpG sites through 123 Mb of genomic content.
We obtained the p-value threshold, 2.7e-08, for differential analysis (pair-wise Wilcoxon rank-sum test for single CpGs) from 1,000 times of permutation test.
The follwing example shows how to estimate the power of biomarkers of 400 samples and a given effect size of 0.05. This command will output a power curve and a .tsv file containing the power analysis results.
# Sample size=400, effect size=0.05, significance threshold= 2.7e-08
circula power -o ./output -s 400 -e 0.05 --step-size 1000 -@ 10
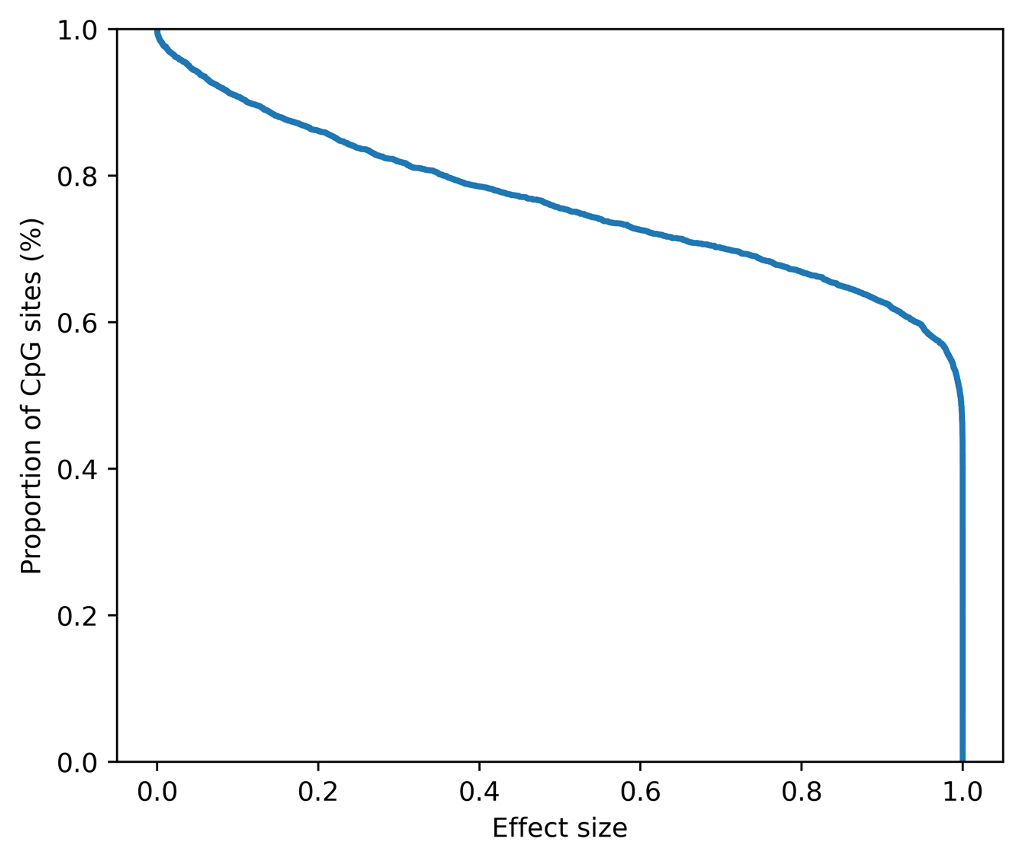
power_analysis_ecdf_plot.png.
Effect size |
Prop. |
|---|---|
0.0 |
1.0 |
0.01 |
0.9761 |
0.02 |
0.9653 |
0.03 |
0.9576 |
… |
… |
0.98 |
0.5599 |
0.99 |
0.5353 |
1.0 |
0.3716 |
Or use a customized p-value threshold:
# Sample size=400, effect size=0.05, significance threshold= 1e-05
circula power -o ./output -s 400 -e 0.05 --step-size 1000 -@ 10 --p-value-threshold 1e-05